

Value and price trends for your Magic collection. Every deck and binder is priced daily and charted like a ticker.
Log what you paid for each card, watch its price move, and see the gain against your cost basis. Proxies are marked and valued at $0. Prices come from Scryfall.
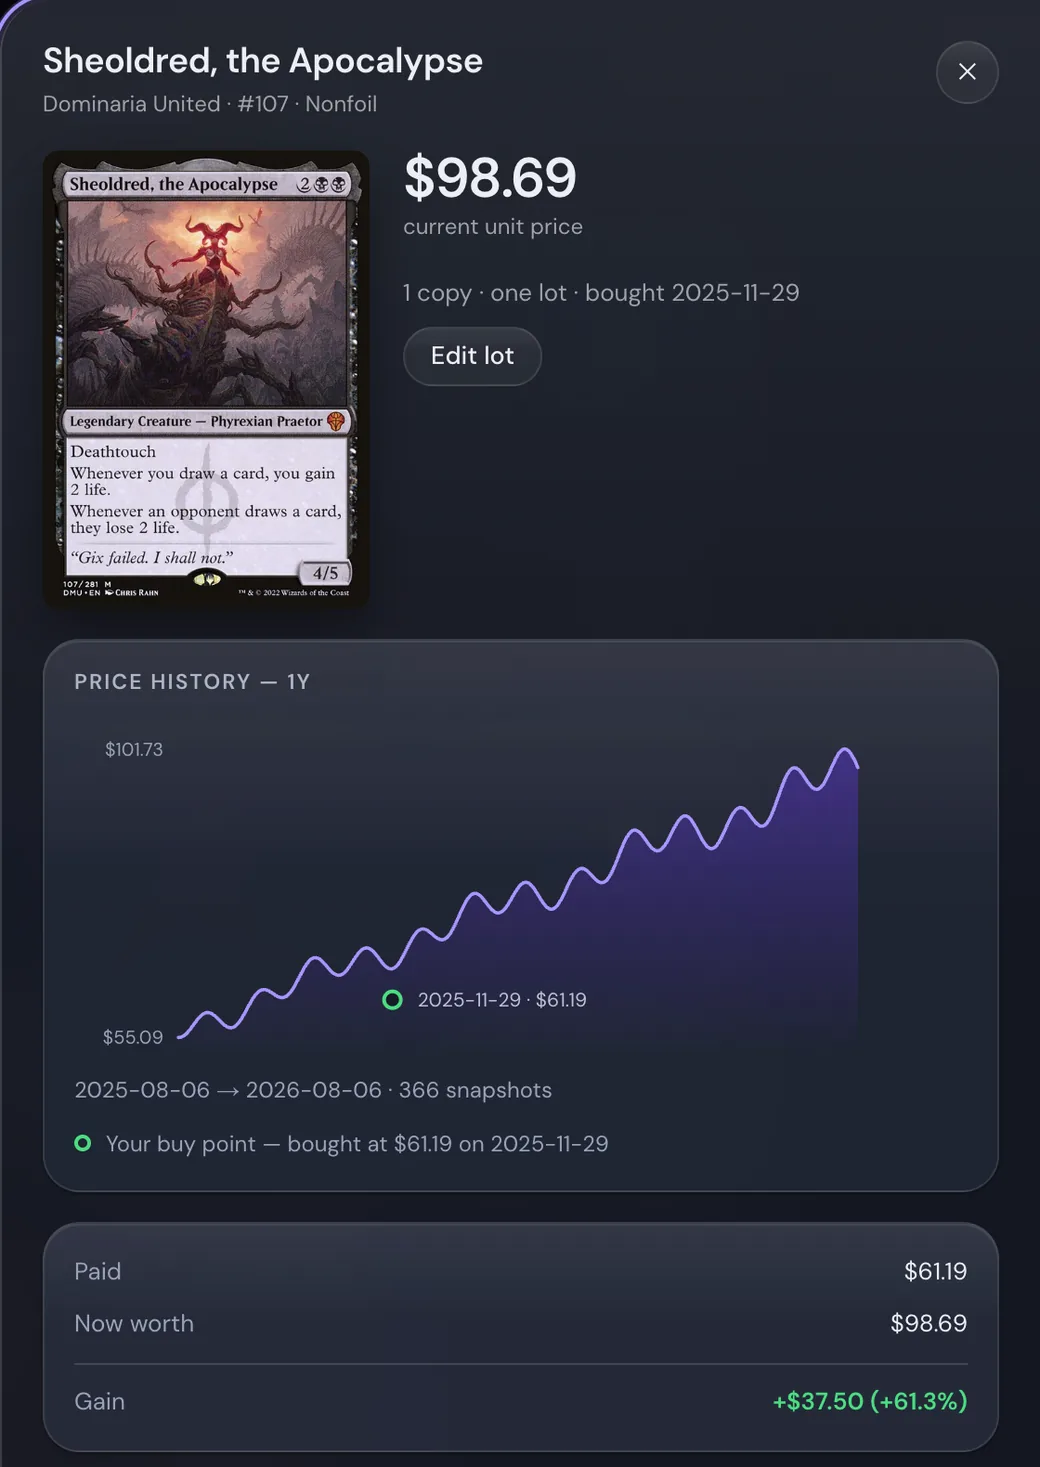
Your buy point, ringed on the line
Open any card to see how its price has moved. The green ring is what you paid, plotted on the day you paid it — so the distance to the line is the trade. Below the chart: paid, worth now, and the gain between them.
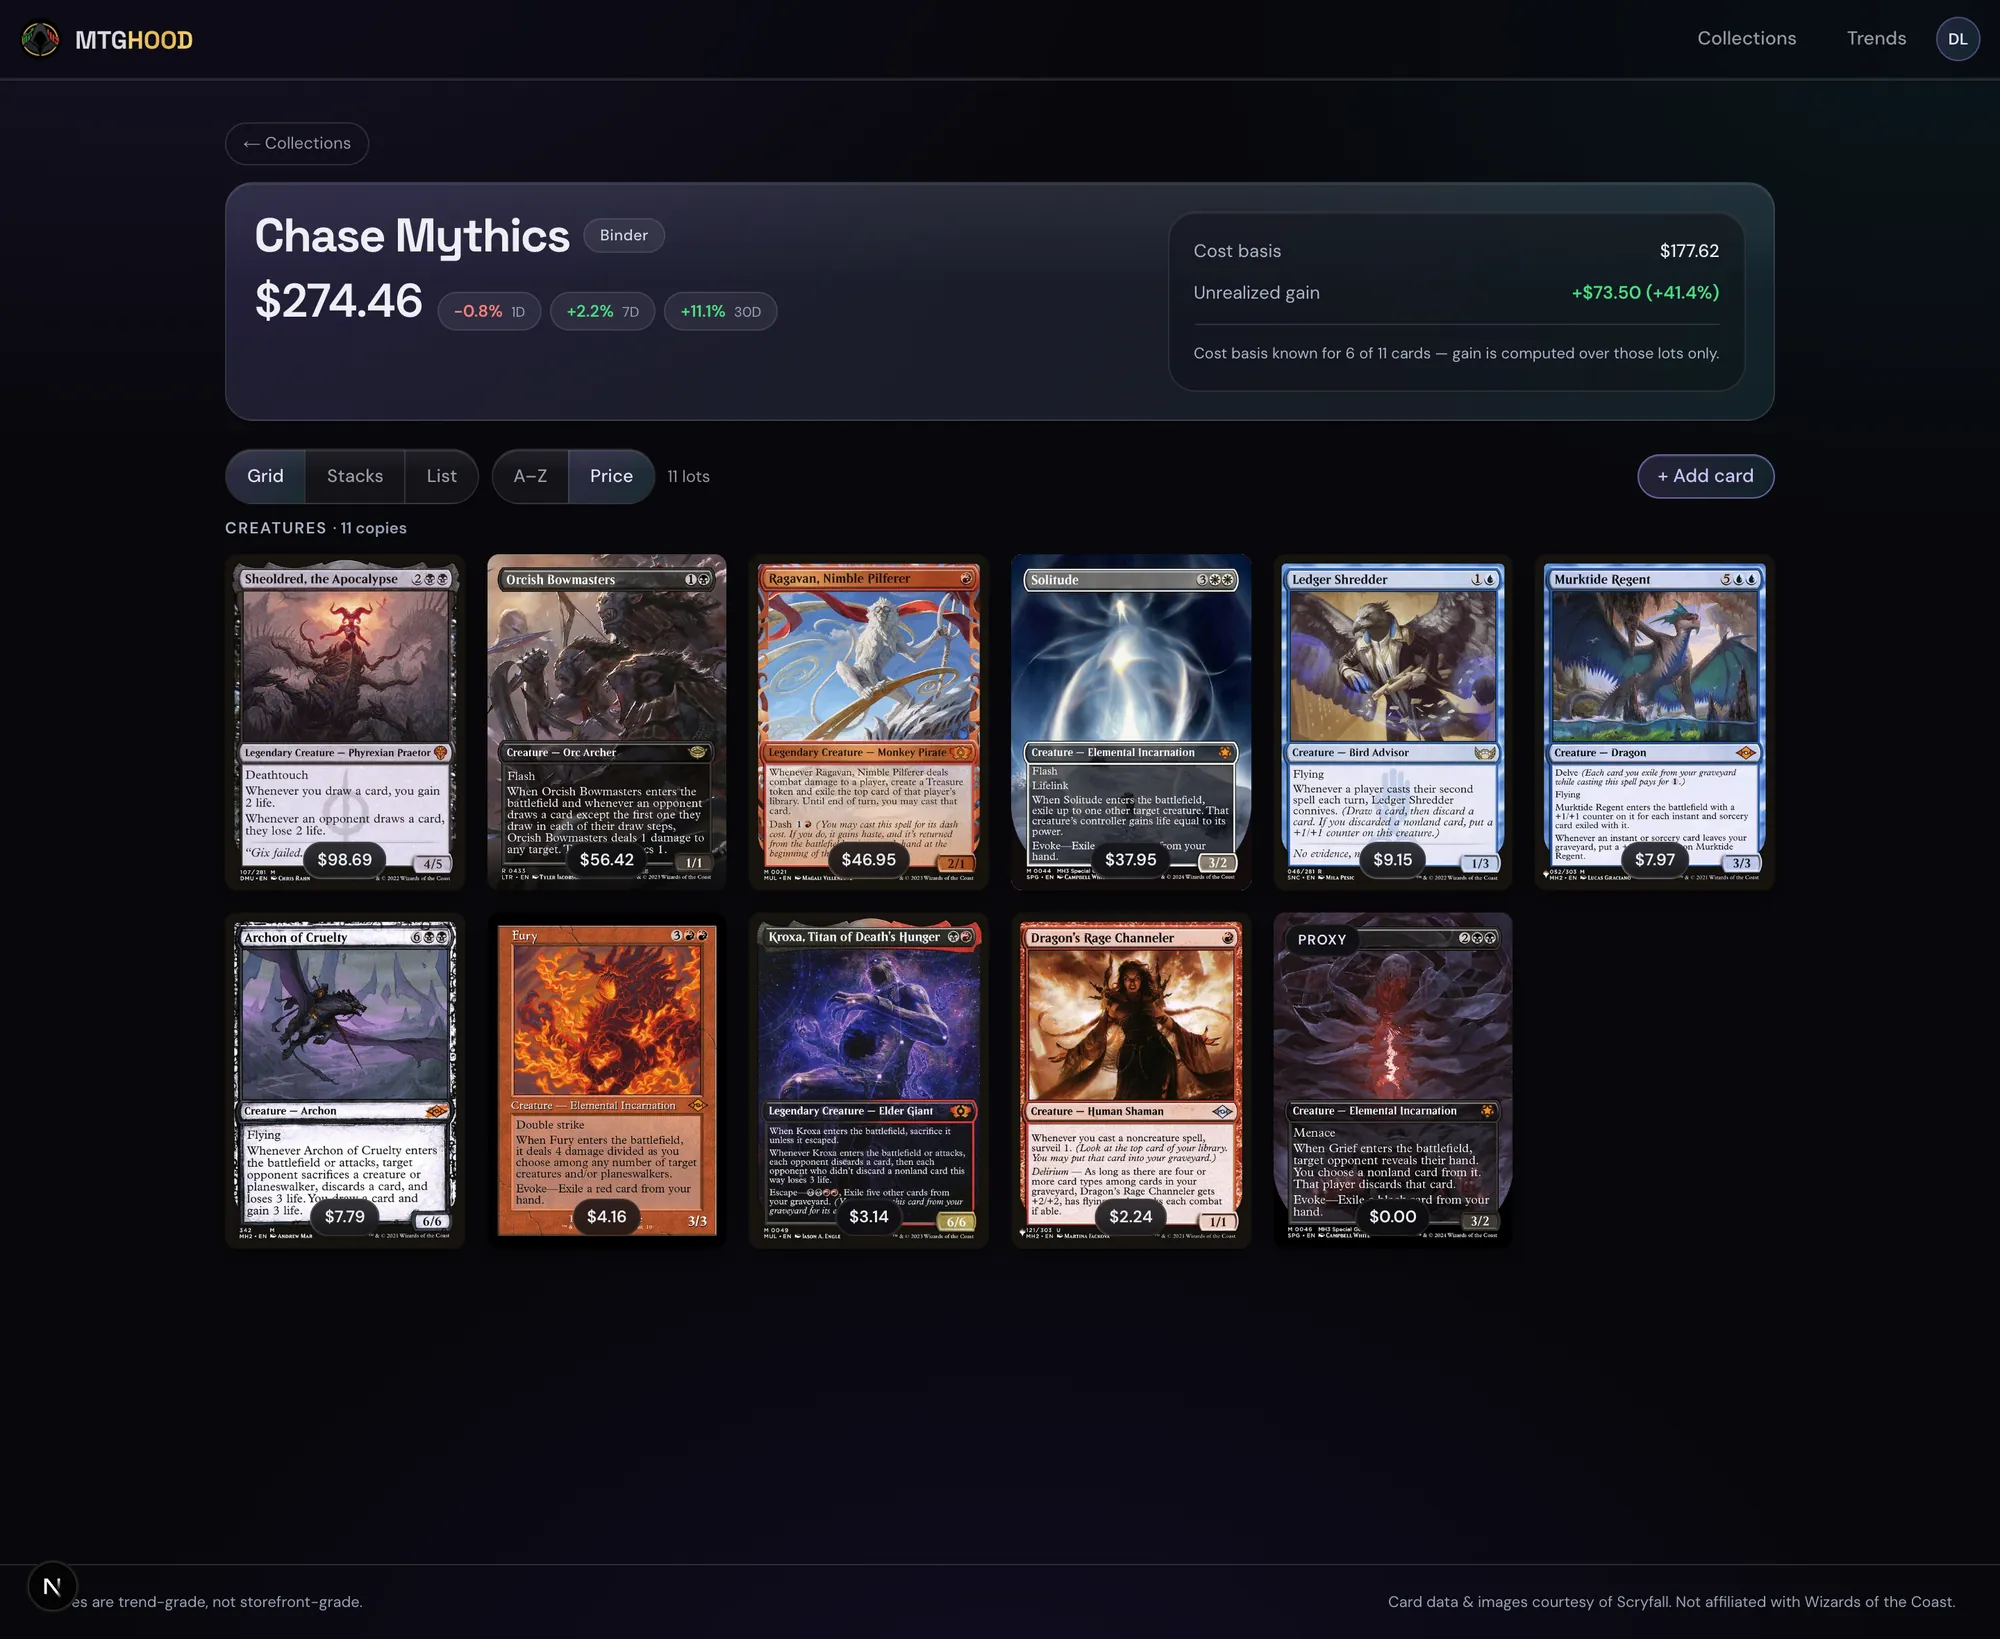
Real card art, priced per copy
A deck or binder in grid view, with the current price on every card. Proxies carry a badge and count as $0 toward value while still showing up. Card images and data come from Scryfall.
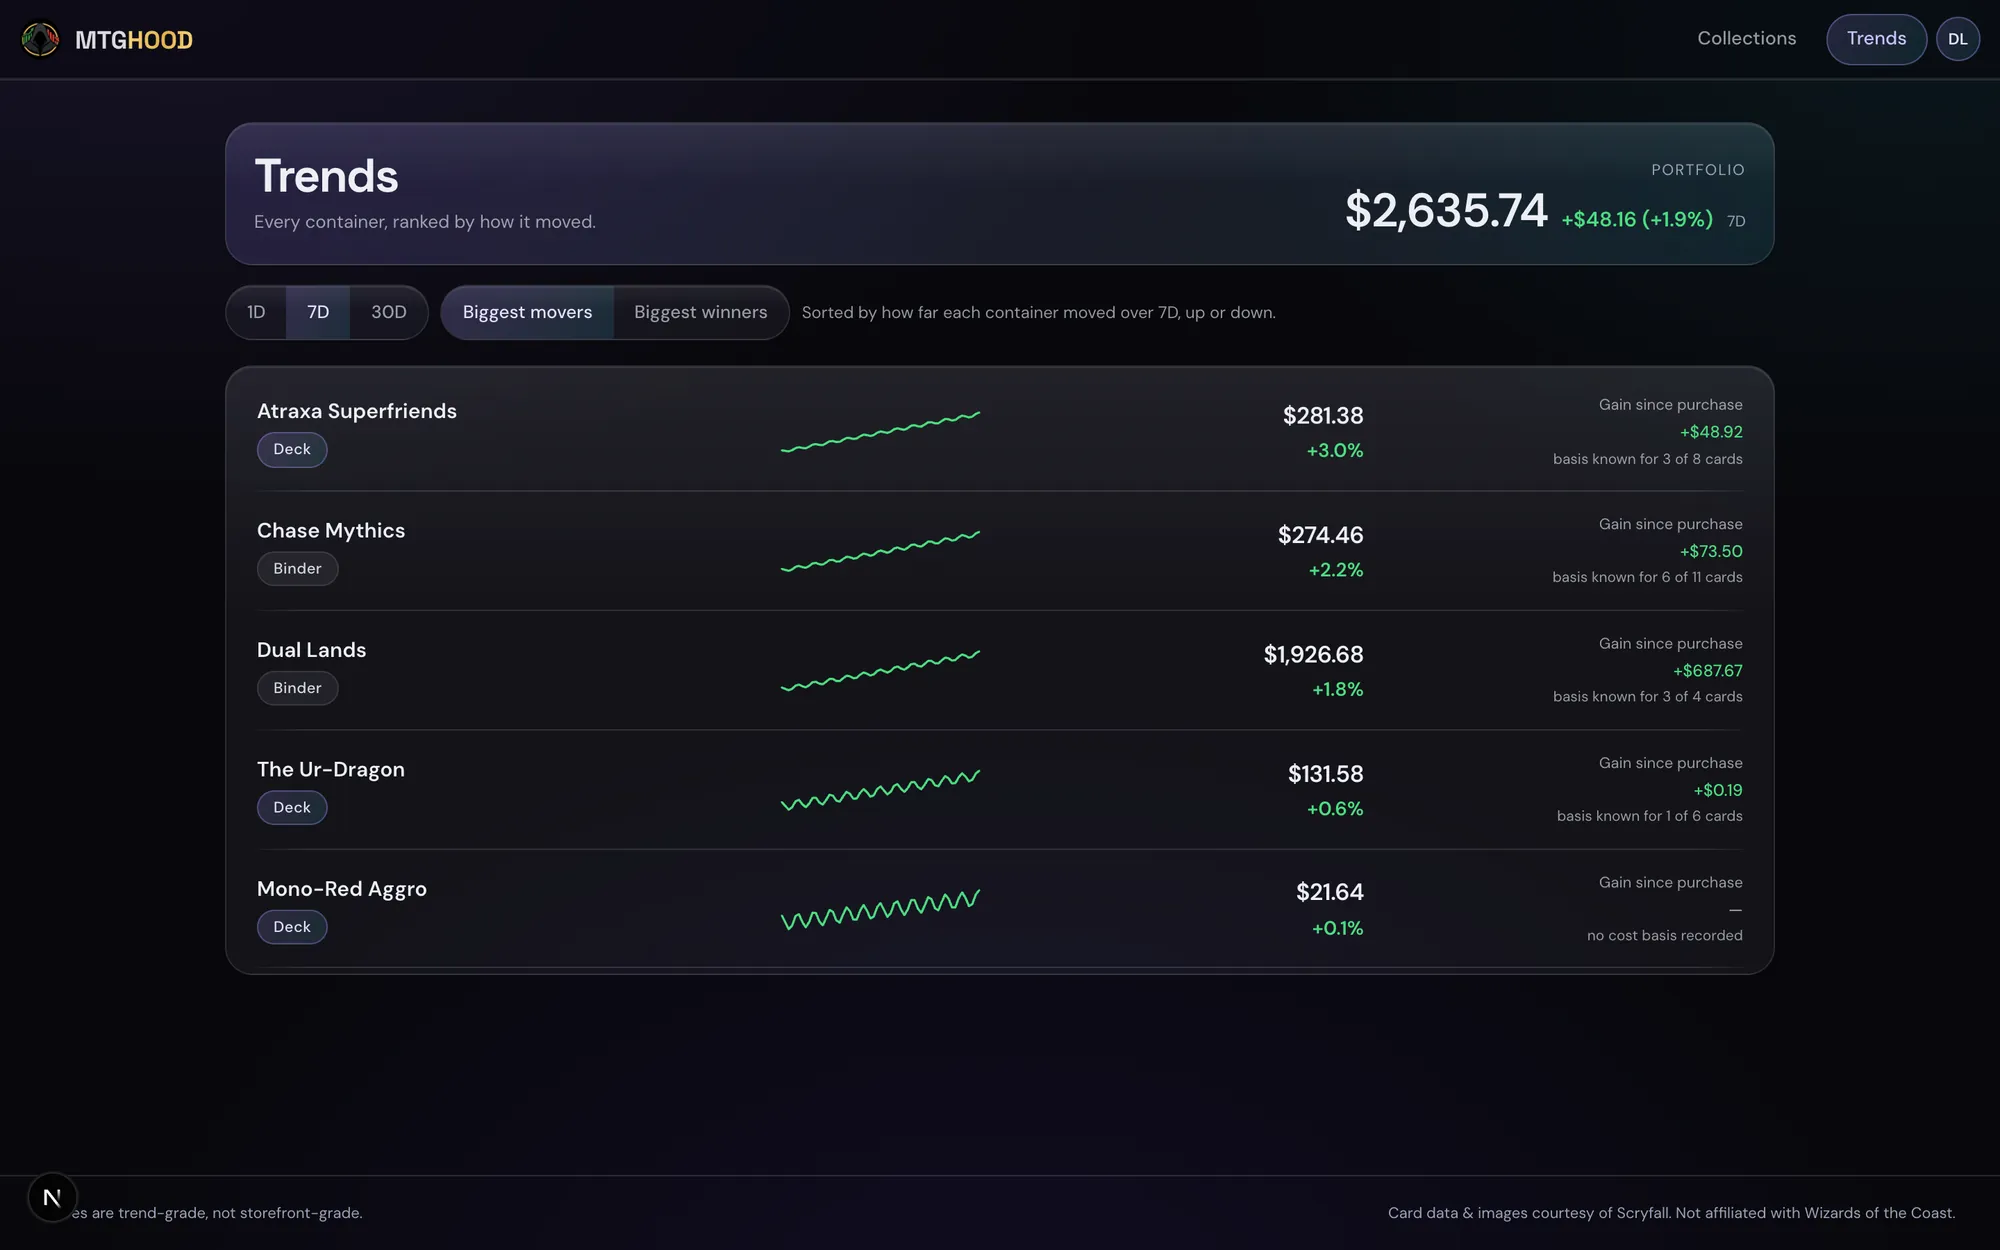
Ranked by how each container moved
Every deck and binder over 1, 7, or 30 days, with a sparkline and the gain since purchase. A percentage appears only when there is a value snapshot old enough to compare against — otherwise the row shows a dash rather than a number invented for it.
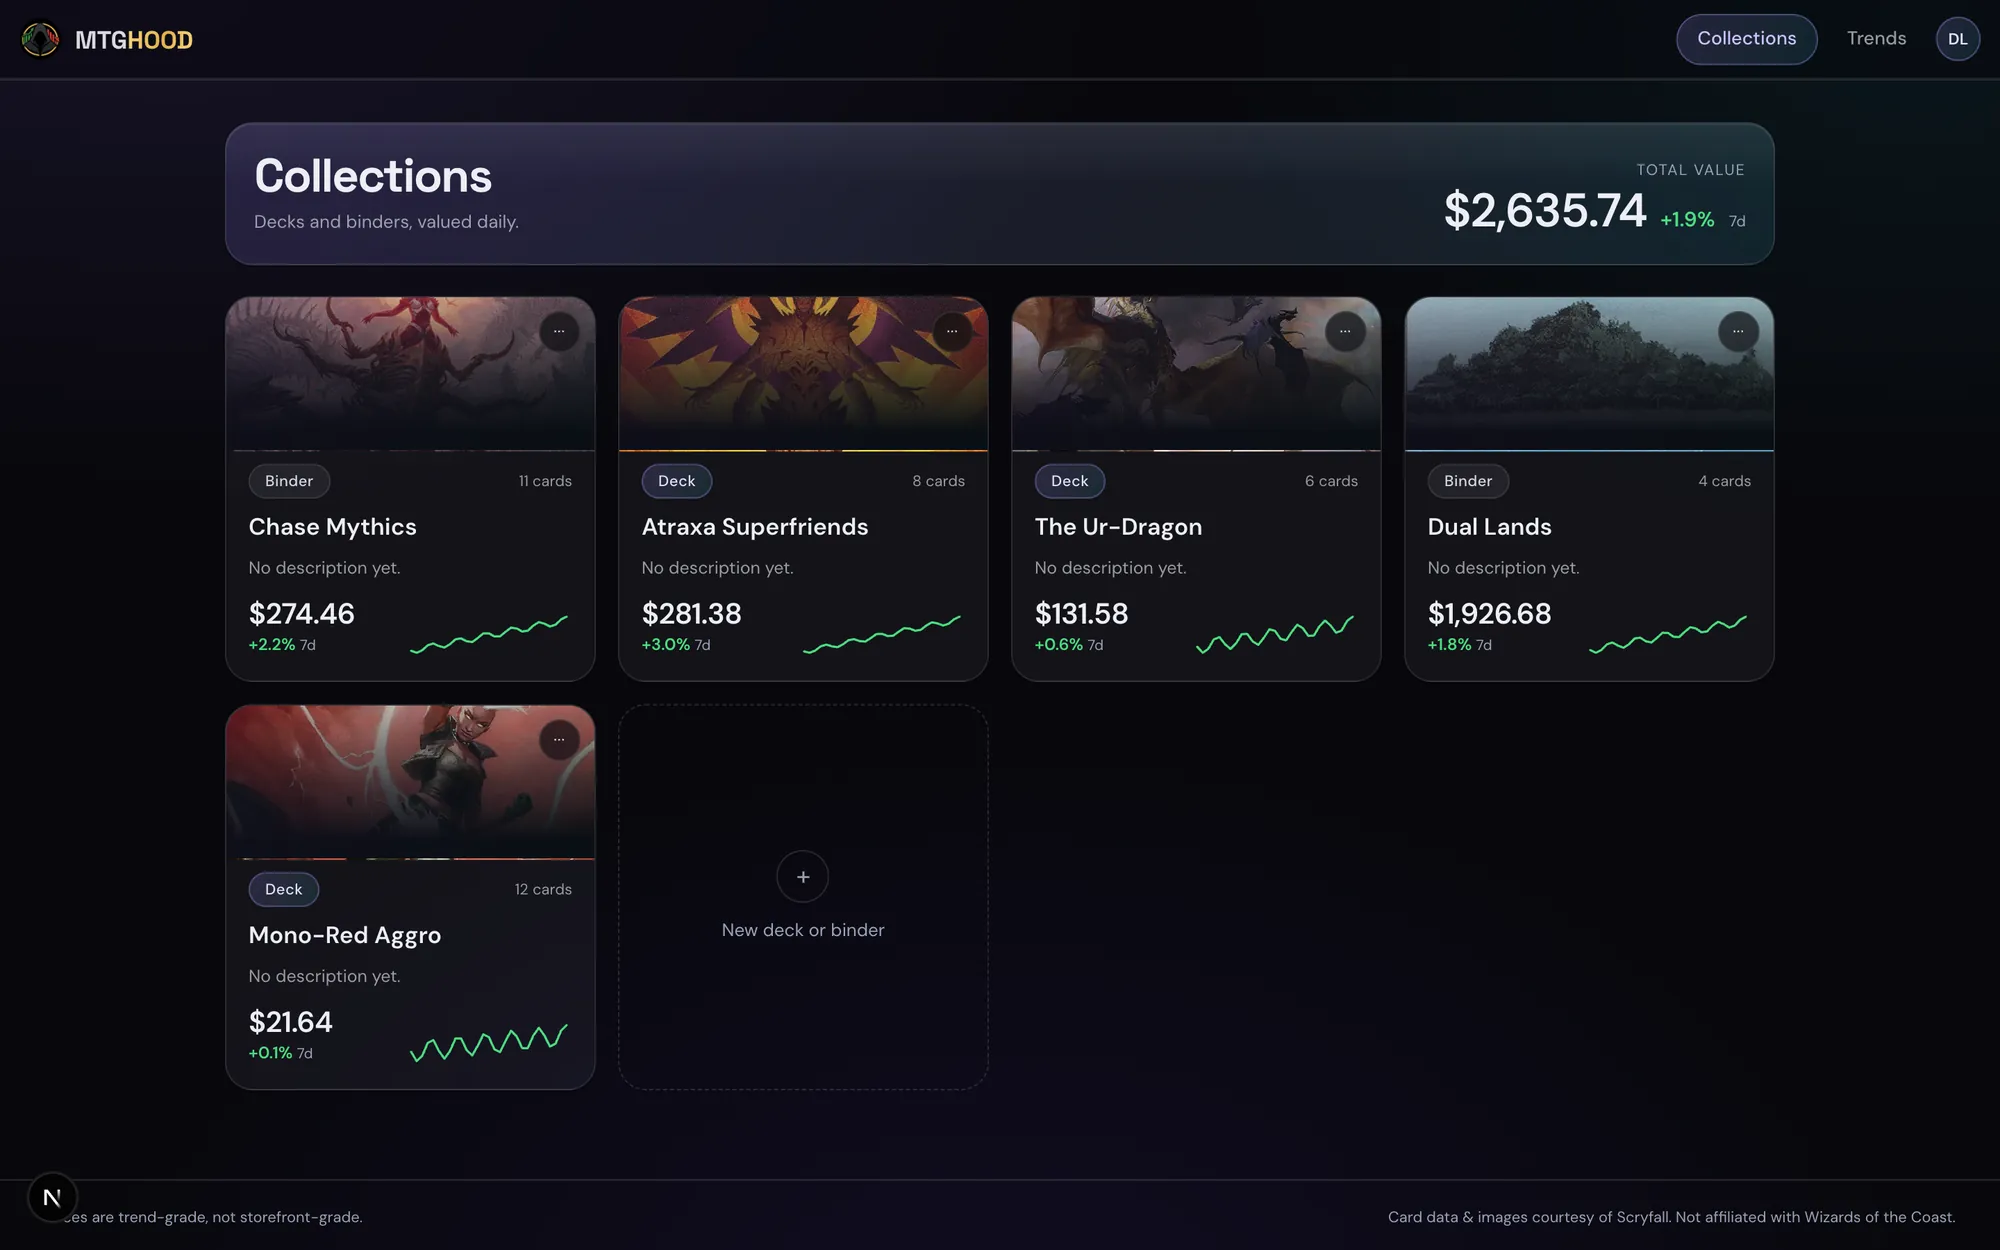
Everything you own, valued daily
The collections home totals every deck and binder and keeps a daily value history for each, drawn as a sparkline on its tile.
Start tracking your collection
Sign in on the app to build your first deck or binder. It reads prices from the same 116,000-printing mirror these screenshots do.
Open the app